MFS-3 Bars Pattern Strategy3 Bar Pattern Strategy
Detects an Ignite Candle followed by a Pullback Candle followed by a Confirmation Candle.
A Box will be drawn around the setup and three arrows will identify I, P, C (Ignite, Pullback, Confirmation) the setup.
The strategy will calculate a Stop Loss below the Low Price of the Ignite candle and a Take Profit at 2 times the Stop Loss giving a Risk to Reward Ratio of 1:2.
Extra conditions are included to reduce false triggers:
- A down trend must be detected using 3 SMA (Long, Medium, Short) that should be aligned from Long to Short one above the other.
- The Ignite Candle's body must be BELOW the Short SMA
An input form is available to adjust some strategy parameters.
Performance Note
----------------------
Trading conditions are very strict, so most of the time, no signals will be detected in the Strategy window.
This strategy should only be one of many strategies used for trade setups.
Hope you enjoy it.
Cerca negli script per "the strat"

R-based Strategy Template [Daveatt]Have you ever wondered how to properly track your trading performance based on risk rather than just profits?
This template solves that problem by implementing R-multiple tracking directly in TradingView's strategy tester.
This script is a tool that you must update with your own trading entry logic.
Quick notes
Before we dive in, I want to be clear: this is a template focused on R-multiple calculation and visualization.
I'm using a basic RSI strategy with dummy values just to demonstrate how the R tracking works. The actual trading signals aren't important here - you should replace them with your own strategy logic.
R multiple logic
Let's talk about what R-multiple means in practice.
Think of R as your initial risk per trade.
For instance, if you have a $10,000 account and you're risking 1% per trade, your 1R would be $100.
A trade that makes twice your risk would be +2R ($200), while hitting your stop loss would be -1R (-$100).
This way of measuring makes it much easier to evaluate your strategy's performance regardless of account size.
Whenever the SL is hit, we lose -1R
Proof showing the strategy tester whenever the SL is hit: i.imgur.com
The magic happens in how we calculate position sizes.
The script automatically determines the right position size to risk exactly your specified percentage on each trade.
This is done through a simple but powerful calculation:
risk_amount = (strategy.equity * (risk_per_trade_percent / 100))
sl_distance = math.abs(entry_price - sl_price)
position_size = risk_amount / (sl_distance * syminfo.pointvalue)
Limitations with lower timeframe gaps
This ensures that if your stop loss gets hit, you'll lose exactly the amount you intended to risk. No more, no less.
Well, could be more or less actually ... let's assume you're trading futures on a 15-minute chart but in the 1-minute chart there is a gap ... then your 15 minute SL won't get filled and you'll likely to not lose exactly -1R
This is annoying but it can't be fixed - and that's how trading works anyway.
Features
The template gives you flexibility in how you set your stop losses. You can use fixed points, ATR-based stops, percentage-based stops, or even tick-based stops.
Regardless of which method you choose, the position sizing will automatically adjust to maintain your desired risk per trade.
To help you track performance, I've added a comprehensive statistics table in the top right corner of your chart.
It shows you everything you need to know about your strategy's performance in terms of R-multiples: how many R you've won or lost, your win rate, average R per trade, and even your longest winning and losing streaks.
Happy trading!
And remember, measuring your performance in R-multiples is one of the most classical ways to evaluate and improve your trading strategies.
Daveatt

FXC NQ Opening Range Breakout Strategy V2.4Mechanical Strategy that trades breakouts on NQ futures on the 15min timeframe during the NYSE session. It's designed to manage Apex and Top Step accounts with the lowest risk possible.
Risk Disclaimer:
Past results as well as strategy tester reports do not indicate future performance. Guarantees do not exist in trading. By using this strategy you risk losing all your money.
Important:
It only trades on Monday, Wednesday and Friday and takes usually only 1 trade per trading day.
It works on the 15min timeframe only.
The settings are optimised already for NQ but feel free to change them.
How it works:
Every selected trading day it measures the range of the first 15min candle after the NYSE open. As soon as price closes above on the 15min timeframe, it will trade the breakout targeting a set risk to reward ratio. SL on the opposite side of the range. It will trail the SL after a set amount of points and uses a buffer of the set amount of points to trail it.
Settings:
Opening Range Time : This is the time of the day in hours and minutes when the strategy starts looking for trades. It's in the EST/ NY Timezone and set to 9:30-09:45 by default
because that's the NYSE open.
Session Time : This is the time of the day in hours and minutes until the strategy trades. It's in the EST/ NY Timezone and set to 09:45-14:45 by default.
because that's what gave the best results in backtesting. Open trades will get closed automatically once the end of the session is reached. No matter if win or loss. This is just to prevent holding positions over night.
Session Border This setting is to select the border color in which the session box will be plotted.
Opening Range Box This setting is to select the fill color of the opening range box.
Opening Range Border This setting is to select the border color of the session box.
Trade Timeframe This setting determines on which timeframe candle has to close outside the opening range box in order to take a trade. It's set to 15min by default because this is what worked by far the best in backtests and live trading.
Stop Loss Buffer in Points: This is simply the buffer in points that is added to the SL for safety reasons. If you have it on 0, the SL will be at the exact price of the opposite side of the range. By default it's set to 0 pips because this is what delivered the best results in backtests.
Profit Target Factor: This is simply the total SL size in points multiplied by x.
Example: If you put 2, you get a 1:2 Risk to Reward Ratio. By Default it's set to 4 because this gave the best results in backtests, because trades always get closed either by trailing SL or because the end of the session is reached.
Use Trailing Stop Loss: This setting is to enable/ disable the trailing stop loss. It's enabled by default because this is a fundamental part of the strategy.
Trailing Stop Buffer: This setting determines after how many points in profit the trailing SL will be activated.
Risk Type: You can chose either between Fixed USD Amount, Risk per Trade in % or Fixed Contract Size. By default it's set to fixed contract size.
Risk Amount (USD or Contracts): This setting is to set how many USD or how many contracts you want to risk per trade. Make sure to check which risk type you have selected before you chose the risk amount.
Use Limit Orders If enabled, the strategy will place a pending order x points from the current price, instead of a market order. Limit orders are enabled by default for a better performance. Important: It doesn't actually place a limit order. The strategy will just wait for a pullback and then enter with a market order. It's more like a hidden limit order.
Limit Order Distance (points): If you have limit orders enabled, this setting determines how many points from the current price the limit order will be placed.
Trading Days: These checkboxes are to select on which week days the strategy has to trade. Thursday is disabled by default because backtests have shown that Thursday is the least profitable day
Backtest Settings:
For the backtest the commissions ere set to 0.35 USD per mini contract which is the highest amount Tradeovate charges. Margin was not accounted for because typically on Apex accounts you can use way more contracts than you need for the extremely low max drawdown. Margin would be important on personal accounts but even there typically it's not an issue at all especially because this strategy runs on the 15min timeframe so it won't use a lot of contracts anyways.
What makes it unique:
This script is unique because it's designed to be used on Apex and Top Step accounts with extremely strict drawdown rules.
The strategy is optimised to be traded with a fixed contract size instead of using % risk. The reason for that is that the drawdown rules of these Futures Prop Accounts are very strict and the fact that the smallest trade-able contract size is 1.
Why the source code is hidden:
The source code is hidden because I invested a lot of time and money into developing this strategy and optimising it with paid 3rd party software. Also since I use it myself on my Apex accounts and prop firms don't allow copy trading I don't want it to be used by too many traders.
Precision Trading Strategy: Golden EdgeThe PTS: Golden Edge strategy is designed for scalping Gold (XAU/USD) on lower timeframes, such as the 1-minute chart. It captures high-probability trade setups by aligning with strong trends and momentum, while filtering out low-quality trades during consolidation or low-volatility periods.
The strategy uses a combination of technical indicators to identify optimal entry points:
1. Exponential Moving Averages (EMAs): A fast EMA (3-period) and a slow EMA (33-period) are used to detect short-term trend reversals via crossover signals.
2. Hull Moving Average (HMA): A 66-period HMA acts as a higher-timeframe trend filter to ensure trades align with the overall market direction.
3. Relative Strength Index (RSI): A 12-period RSI identifies momentum. The strategy requires RSI > 55 for long trades and RSI < 45 for short trades, ensuring entries are backed by strong buying or selling pressure.
4. Average True Range (ATR): A 14-period ATR ensures trades occur only during volatile conditions, avoiding choppy or low-movement markets.
By combining these tools, the PTS: Golden Edge strategy creates a precise framework for scalping and offers a systematic approach to capitalize on Gold’s price movements efficiently.

TheHorsyAlgoPROThe Horsy algo is an automated strategy that uses any minute Higher timeframe range as reference and search for a purge of liquidity on the HTF high or low where buyside or sell side liquidity is, the algo only search this at specific desired times that can be configured according to the time you usually trade, the strategy is known as Turtle soup purge and reverse or lately as CRT.
Why is useful?
The purpose of this Algorithm is to help turtle soup traders to quickly identify when the market is likely to reverse the algo evaluates if the opportunity is worth it, base on risk reward and other desired filters. Also this strategy can help to quickly backtest the trader strategy it can be configured in different timeframes and adapt to the trader personality, they can easily see the results and statistics and notice if its profitable or not.
This algo is useful for intraday traders looking for a purge and reverse at a key times and at key HTF price levels this only looks the previous HTF highs and lows but is important to also monitor Order blocks, FVGs, gaps, or wicks to have the best results.
How it works and how it does it?
The Horsy algo simply Jumps from one type of liquidity to another one buyside to sell side or vice versa. In order for the algo to trigger an entry it has to meet these conditions
1. Take HTF liquidity, trade above a HTF high or below a HTF low in the selected time window
2. Make a change in the state of delivery with a close below the previous candle low for shorts and close above previous candle high for longs.
3. Allow for a reasonable risk reward, it will use the highest high for shorts and the lowest low for longs. The default take profit is the opposite side of the range.
4. Validate others user filters this include enter only trades aligned with the HTF bias, or trades aligned with the LTF bias or booth. The algo have the option to enter only premium and discount entries. And finally, an option to allow for different contract sizes depending of the maximum percent of the account we want to risk default is 1%. For this last option is important to check the initial balance and leverage are configured correctly, is disable by default because it requires more capital to perform well.
We can see the algo performing in the picture below with a short trade, notice there are some white lines, they are the high or the low of HTF candle that start generating inside candles in the HTF meaning a possible consolidation. The algo plots the HTF ranges in a shaded boxes as you can see below
The HTF bias as you can see in the picture is calculated based on the last close of the HTF meaning close above previous HTF high is bullish close below previous HTF low is bearish. This HTF bias level is also the last HTF mid-price or 50%. By default, this line is enabled.
The LTF bias is calculated based on the range created from the expansion outside the previous HTF range is also the mid-price. If the LTF close above previous HTF high is bullish and if the LTF close below previous HTF low is bearish. By default this LTF bias line is disable.
This strategy includes an original and personal developed code that uses dealing ranges to recognize if the market is expanding, retracing, reversing or consolidating. This allow the algo to exit the position when it detects a retracement or at the end of the expansion. This is the default exit type.
You can monitor the previous dealing ranges created in history with an option than can be enable, by default is disable, this ranges are created after price takes buyside and then sell side or vice versa. So this dealing ranges can be useful also to identify minor pools of liquidity and premium and discount in the lower timeframe.
The picture below is a long example, the exit in this case is just at the high of the range. The normal take profit is in a blue line for longs.
How to use it?
First select the desired HTF timeframe recommended is from 30min to 240min then you setup the chart on the lower timeframe you want to trade recommended is from 1min to 15min to enter. By default This strategy is designed to work for intraday during key times when price take stops and then moves quickly away from them. You can select as much as 6 different times or just one. After you select the desired time window where the algo will look for the purge and reverse, They are highlighted in the candles that change colors excluding the gray ones that indicates consolidation.
Then the Algo allow to performs several additional filters in the entries you can select if you want to trade only longs or shorts trades, you can select when to move the stop loss to Break even. In deviations of the risk or you can just select to remove risk when price hits the 50% of previous HTF range.
You can select the minimum desired risk reward of the trade before is allow to be taken. Once is configured correctly the algo should trigger signals with a triangle up or down plus the strategy entry.
At the beginning of the picture there are some blue lines in the HTF high low and close, this is to easily identify that the market is in the Asia session, the time can be configured by the user, these lines are normally gray.
On the right top of the screen you can see some statistics about the strategy how many trades it took, ARR is an approximated value of the accumulated total risk reward of all the trades when they get closed in the simulation.
Profit factor and percent profitable are also shown should be green it means that the strategy makes money over time. But apart from that is important to notice how it makes money it is stable over time? it is a roller coaster? that why I Include this other measurements MxcsTps is the maximum consecutives take profits and Mxcsls is the maximum consecutive stop losses it takes, the slash number after it is the consecutive Break evens. So this way you know what to expect and what is normal in the strategy.
The algo shows all the times the stop loss, take profit and break even level if enable in the colored red lines for short and blue lines for longs. You can also select how price will manage the profit or stoploss point meaning that you can choose to wait for the candle to close to invalidate your idea or to take profit. This is good to avoid liquidity sweeps but can also lead to mayor loses if the idea is wrong. The default setting is to close the trade when price takes the high or low where the stoploss is, the take profit is taken after a retracement to allow to profit on expansions. You can select also to exit on a reversal if you want to ride all the move. This last option has to be used with caution because sometimes price just retrace or reverse very fast decreasing the trade profit and overall strategy performance.
The algo have the option to use standard deviation from the normal risk if you prefer to prevent liquidity sweeps near the stop level this make wider stops but can lead to increased loses so it has to be used carefully.
Below is a picture that show the entry stop and take profit levels with an exit on a retracement activated.
Strategy Results
The backtesting results are obtained simulating a 2000usd account in the Micro Nasdaq using 1 contract per trade. Commission are set to 2usd per contract, slippage to 1tick. You can see in list of trades we are not risking more than 1 % percent of the account. The backtested range is from august to November 2024. This strategy doesn’t generate too much trades because of the time filters and conditions that has to be meet to take an entry but you can see the results of the last 4months with the available data that are around 32 trades.
The default settings for this strategy is HTF as 240min designed to work on a LTF 5min chart, the default purge times are 245-300, 745-800, 845-900, 1045-1100 and 1245-1300 UTC-4, the algo will look for shorts or longs, with a minimum risk reward of 2.0. With an additional filter of the HTFBias. The take profit is by default taken on the first retracement after hitting the target. The default settings are optimized to work on the Nasdaq or Spy, but can also perform well in other assets with the correct adjustments.
Remember entries constitute only a small component of a complete winning strategy. Other factors like risk management, position-sizing, trading frequency, trading fees, and many others must also be properly managed to achieve profitability. Past performance doesn’t guarantee future results. To really take advantage of this strategy you have to study turtle soup and the HTF key levels use this only as a confirmation that your overall idea will play out and use it to backtest your model.
Summary of features
·Adaptable strategy to different HTF timeframes from 1-1440min
· Select up to 6 different purge time windows UTC-4, UTC-5
· Choose desired Risk Reward per trade
· Easily see the HTF high low close and 50% key levels in the LTF
· Identify HTF consolidations that generate key major liquidity pools
· HTF/LTF bias filters to trade in favor of the big trend or in sync
· Shaded boxes that indicate if the market is bullish, bearish or consolidating
· See the current midpoint of the last expansion move
· Optimal trade entry filter to trade only in a discount or premium
· Customizable trade management take profit, stop, breakeven level
· Option to exit on a close, retracement or reversal after hitting the take profit level
· Option to exit on a close or reversal after hitting stop loss
· Configurable breakeven point with standard deviations or at 50% of the HTF
· Calculate different contract sizes depending of a percentage of the initial balance
· Standard deviations from normal risk can be used to prevent liquidity sweeps
· See dealing ranges history to check minor pools of liquidity and premium or discount
· Dashboard with instant statistics about the strategy current settings

16. SMC Strategy with SL - low TimeframeOverview
The "SMC Strategy with SL - low Timeframe" is a comprehensive trading strategy that uses key concepts from Smart Money Theory to identify favorable areas in the market for buying or selling. This strategy takes advantage of price imbalances, support and resistance zones, and swing highs/lows to generate high-probability trade signals.
The key features of this strategy include:
Swing High/Low Analysis: Used to determine the Premium, Equilibrium, and Discount Zones.
Order Block Integration: An added layer of confluence to identify valid buy and sell signals.
Trend Direction Confirmation: Using a Simple Moving Average (SMA) to determine the overall trend.
Entry and Exit Rules: Based on price position relative to key zones and moving average, along with optional stop-loss and take-profit levels.
Detailed Description
Swing High and Swing Low Analysis
The script calculates Swing High and Swing Low based on the most recent price highs and lows over a specified look-back period (swingHighLength and swingLowLength, set to 8 by default).
It then derives the Premium, Equilibrium, and Discount Zones:
Premium Zone: Represents potential resistance, calculated based on recent swing highs.
Discount Zone: Represents potential support, calculated based on recent swing lows.
Equilibrium: The midpoint between Swing High and Swing Low, dividing the price range into Premium (above equilibrium) and Discount (below equilibrium) areas.
Zone Visualization
The strategy plots the Premium Zone (resistance) in red, the Discount Zone (support) in green, and the Equilibrium level in blue on the chart. This helps visually assess the current price relative to these important areas.
Simple Moving Average (SMA)
A 50-period Simple Moving Average (SMA) is added to help identify the trend direction.
Buy signals are valid only if the price is above the SMA, indicating an uptrend.
Sell signals are valid only if the price is below the SMA, indicating a downtrend.
Entry Rules
The script generates buy or sell signals when certain conditions are met:
A buy signal is triggered when:
Price is below the Equilibrium and within the Discount Zone.
Price is above the SMA.
The buy signal is further confirmed by the presence of an Order Block (recent lowest price area).
A sell signal is triggered when:
Price is above the Equilibrium and within the Premium Zone.
Price is below the SMA.
The sell signal is further confirmed by the presence of an Order Block (recent highest price area).
Order Block
The strategy defines Order Blocks as recent highs and lows within a look-back period (orderBlockLength set to 20 by default).
These blocks represent areas where large players (smart money) have historically been active, increasing the probability of the price reacting in these areas again.
Trade Management and Trade Direction
The user can set Trade Direction to either "Long Only," "Short Only," or "Both." This allows the strategy to adapt based on market conditions or trading preferences.
Based on the Trade Direction, the strategy either:
Closes open trades that are against new signals.
Allows only specific directional trades (either long or short).
Stop-loss levels are defined based on a fixed percentage (stop_loss_percent), which helps to manage risk and minimize losses.
Exit Rules
The strategy uses stop-loss levels for risk management.
A stop-loss price is set at a fixed percentage below the entry price for long positions or above the entry price for short positions.
When the price hits the defined stop-loss level, the trade is closed.
Liquidity Zones
The script identifies recent Swing Highs and Lows as potential liquidity zones. These are levels where price could react strongly, as they represent areas of interest for large traders.
The liquidity zones are plotted as crosses on the chart, marking areas where price may encounter significant buying or selling pressure.
Visual Feedback
The script uses visual markers (green for buy signals and red for sell signals) to indicate potential entries on the chart.
It also plots liquidity zones to help traders identify areas where stop hunts and liquidity grabs might occur.
Monthly Performance Dashboard
The script includes a performance tracking feature that displays monthly profit and loss metrics on the chart.
This dashboard allows the trader to see a visual representation of trading performance over time, providing insights into profitability and consistency.
The table shows profit or loss for each month and year, allowing the user to track the overall success of the strategy.
Key Benefits
Smart Money Concepts (SMC): This strategy incorporates SMC principles like order blocks and liquidity zones, which are used by institutional traders to determine potential market moves.
Zone Analysis: The use of Premium, Discount, and Equilibrium zones provides a solid framework for determining where to enter and exit trades based on price discounts or premiums.
Confluence: Signals are not taken in isolation. They are confirmed by factors like trend direction (SMA) and order blocks, providing greater trade accuracy.
Risk Management: By integrating stop-loss functionality, traders can manage their risks effectively.
Visual Performance Metrics: The monthly and yearly performance dashboard gives valuable feedback on how well the strategy has performed historically.
Practical Use
Buy in Discount Zone: Traders would be looking to buy when the price is discounted relative to its recent range and is above the SMA, indicating an overall uptrend.
Sell in Premium Zone: Conversely, traders would be looking to sell when the price is at a premium relative to its recent range and below the SMA, indicating an overall downtrend.
Order Block Confirmation: Ensures that buying or selling is supported by historical price behavior at significant levels, providing confidence that the market is likely to react at these areas.
This strategy is designed to help traders take advantage of price inefficiencies and areas where institutional traders are likely to be active, increasing the odds of successful trades. By leveraging Smart Money concepts and strong technical confluence, it aims to provide high-probability trade setups.

ADX Breakout Strategy█ OVERVIEW
The ADX Breakout strategy leverages the Average Directional Index (ADX) to identify and execute breakout trades within specified trading sessions. Designed for the NQ and ES 30-minute charts, this strategy aims to capture significant price movements while managing risk through predefined stop losses and trade limits.
This strategy was taken from a strategy that was posted on YouTube. I would link the video, but I believe is is "against house rules".
█ CONCEPTS
The strategy is built upon the following key concepts:
ADX Indicator: Utilizes the ADX to gauge the strength of a trend. Trades are initiated when the ADX value is below a certain threshold, indicating potential for trend development.
Trade Session Management: Limits trading to specific hours to align with optimal market activity periods.
Risk Management: Implements a fixed dollar stop loss and restricts the number of trades per session to control exposure.
█ FEATURES
Customizable Stop Loss: Set your preferred stop loss amount to manage risk effectively.
Trade Session Configuration: Define the trading hours to focus on the most active market periods.
Entry Conditions: Enter long positions when the price breaks above the highest close in the lookback window and the ADX indicates potential trend strength.
Trade Limits: Restrict the number of trades per session to maintain disciplined trading.
Automated Exit: Automatically closes all positions at the end of the trading session to avoid overnight risk.
█ HOW TO USE
Configure Inputs :
Stop Loss ($): Set the maximum loss per trade.
Trade Session: Define the active trading hours.
Highest Lookback Window: Specify the number of bars to consider for the highest close.
Apply the Strategy :
Add the ADX Breakout strategy to your chart on TradingView.
Ensure you are using a 30-minute timeframe for optimal performance.
█ LIMITATIONS
Market Conditions: The strategy is optimized for trending markets and may underperform in sideways or highly volatile conditions.
Timeframe Specific: Designed specifically for 30-minute charts; performance may vary on different timeframes.
Single Asset Focus: Primarily tested on NQ and ES instruments; effectiveness on other symbols is not guaranteed.
█ DISCLAIMER
This ADX Breakout strategy is provided for educational and informational purposes only. It is not financial advice and should not be construed as such. Trading involves significant risk, and you may incur substantial losses. Always perform your own analysis and consider your financial situation before using this or any other trading strategy. The source material for this strategy is publicly available in the comments at the beginning of the code script. This strategy has been published openly for anyone to review and verify its methodology and performance.

Global Index Spread RSI StrategyThis strategy leverages the relative strength index (RSI) to monitor the price spread between a global benchmark index (such as AMEX) and the currently opened asset in the chart window. By calculating the spread between these two, the strategy uses RSI to identify oversold and overbought conditions to trigger buy and sell signals.
Key Components:
Global Benchmark Index: The strategy compares the current asset with a predefined global index (e.g., AMEX) to measure relative performance. The choice of a global benchmark allows the trader to analyze the current asset's movement in the context of broader market trends.
Spread Calculation:
The spread is calculated as the percentage difference between the current asset's closing price and the global benchmark index's closing price:
Spread=Current Asset Close−Global Index CloseGlobal Index Close×100
Spread=Global Index CloseCurrent Asset Close−Global Index Close×100
This metric provides a measure of how the current asset is performing relative to the global index. A positive spread indicates the asset is outperforming the benchmark, while a negative spread signals underperformance.
RSI of the Spread: The RSI is then calculated on the spread values. The RSI is a momentum oscillator that ranges from 0 to 100 and is commonly used to identify overbought or oversold conditions in asset prices. An RSI below 30 is considered oversold, indicating a potential buying opportunity, while an RSI above 70 is overbought, suggesting that the asset may be due for a pullback.
Strategy Logic:
Entry Condition: The strategy enters a long position when the RSI of the spread falls below the oversold threshold (default 30). This suggests that the asset may have been oversold relative to the global benchmark and might be due for a reversal.
Exit Condition: The strategy exits the long position when the RSI of the spread rises above the overbought threshold (default 70), indicating that the asset may have become overbought and a price correction is likely.
Visual Reference:
The RSI of the spread is plotted on the chart for visual reference, making it easier for traders to monitor the relative strength of the asset in relation to the global benchmark.
Overbought and oversold levels are also drawn as horizontal reference lines (70 and 30), along with a neutral level at 50 to show market equilibrium.
Theoretical Basis:
The strategy is built on the mean reversion principle, which suggests that asset prices tend to revert to a long-term average over time. When prices move too far from this mean—either being overbought or oversold—they are likely to correct back toward equilibrium. By using RSI to identify these extremes, the strategy aims to profit from price reversals.
Mean Reversion: According to financial theory, asset prices oscillate around a long-term average, and any extreme deviation (overbought or oversold conditions) presents opportunities for price corrections (Poterba & Summers, 1988).
Momentum Indicators (RSI): The RSI is widely used in technical analysis to measure the momentum of an asset. Its application to the spread between the asset and a global benchmark allows for a more nuanced view of relative performance and potential turning points in the asset's price trajectory.
Practical Application:
This strategy works best in markets where relative strength is a key factor in decision-making, such as in equity indices, commodities, or forex markets. By assessing the performance of the asset relative to a global benchmark and utilizing RSI to identify extremes in price movements, the strategy helps traders to make more informed decisions based on potential mean reversion points.
While the "Global Index Spread RSI Strategy" offers a method for identifying potential price reversals based on relative strength and oversold/overbought conditions, it is important to recognize that no strategy is foolproof. The strategy assumes that the historical relationship between the asset and the global benchmark will hold in the future, but financial markets are subject to a wide array of unpredictable factors that can lead to sudden changes in price behavior.
Risk of False Signals:
The strategy relies heavily on the RSI to trigger buy and sell signals. However, like any momentum-based indicator, RSI can generate false signals, particularly in highly volatile or trending markets. In such conditions, the strategy may enter positions too early or exit too late, leading to potential losses.
Market Context:
The strategy may not account for macroeconomic events, news, or other market forces that could cause sudden shifts in asset prices. External factors, such as geopolitical developments, monetary policy changes, or financial crises, can cause a divergence between the asset and the global benchmark, leading to incorrect conclusions from the strategy.
Overfitting Risk:
As with any strategy that uses historical data to make decisions, there is a risk of overfitting the model to past performance. This could result in a strategy that works well on historical data but performs poorly in live trading conditions due to changes in market dynamics.
Execution Risks:
The strategy does not account for slippage, transaction costs, or liquidity issues, which can impact the execution of trades in real-market conditions. In fast-moving markets, prices may move significantly between order placement and execution, leading to worse-than-expected entry or exit prices.
No Guarantee of Profit:
Past performance is not necessarily indicative of future results. The strategy should be used with caution, and risk management techniques (such as stop losses and position sizing) should always be implemented to protect against significant losses.
Traders should thoroughly test and adapt the strategy in a simulated environment before applying it to live trades, and consider seeking professional advice to ensure that their trading activities align with their risk tolerance and financial goals.
References:
Poterba, J. M., & Summers, L. H. (1988). Mean Reversion in Stock Prices: Evidence and Implications. Journal of Financial Economics, 22(1), 27-59.

Adaptive Squeeze Momentum StrategyThe Adaptive Squeeze Momentum Strategy is a versatile trading algorithm designed to capitalize on periods of low volatility that often precede significant price movements. By integrating multiple technical indicators and customizable settings, this strategy aims to identify optimal entry and exit points for both long and short positions.
Key Features:
Long/Short Trade Control:
Toggle Options: Easily enable or disable long and short trades according to your trading preferences or market conditions.
Flexible Application: Adapt the strategy for bullish, bearish, or neutral market outlooks.
Squeeze Detection Mechanism:
Bollinger Bands and Keltner Channels: Utilizes the convergence of Bollinger Bands inside Keltner Channels to detect "squeeze" conditions, indicating a potential breakout.
Dynamic Squeeze Length: Calculates the average squeeze duration to adapt to changing market volatility.
Momentum Analysis:
Linear Regression: Applies linear regression to price changes over a specified momentum length to gauge the strength and direction of momentum.
Dynamic Thresholds: Sets momentum thresholds based on standard deviations, allowing for adaptive sensitivity to market movements.
Momentum Multiplier: Adjustable setting to fine-tune the aggressiveness of momentum detection.
Trend Filtering:
Exponential Moving Average (EMA): Implements a trend filter using an EMA to align trades with the prevailing market direction.
Customizable Length: Adjust the EMA length to suit different trading timeframes and assets.
Relative Strength Index (RSI) Filtering:
Overbought/Oversold Signals: Incorporates RSI to avoid entering trades during overextended market conditions.
Adjustable Levels: Set your own RSI oversold and overbought thresholds for personalized signal generation.
Advanced Risk Management:
ATR-Based Stop Loss and Take Profit:
Adaptive Levels: Uses the Average True Range (ATR) to set stop loss and take profit points that adjust to market volatility.
Custom Multipliers: Modify ATR multipliers for both stop loss and take profit to control risk and reward ratios.
Minimum Volatility Filter: Ensures trades are only taken when market volatility exceeds a user-defined minimum, avoiding periods of low activity.
Time-Based Exit:
Holding Period Multiplier: Defines a maximum holding period based on the momentum length to reduce exposure to adverse movements.
Automatic Position Closure: Closes positions after the specified holding period is reached.
Session Filtering:
Trading Session Control: Limits trading to predefined market hours, helping to avoid illiquid periods.
Custom Session Times: Set your preferred trading session to match market openings, closings, or specific timeframes.
Visualization Tools:
Indicator Plots: Displays Bollinger Bands, Keltner Channels, and trend EMA on the chart for visual analysis.
Squeeze Signals: Marks squeeze conditions on the chart, providing clear visual cues for potential trade setups.
Customization Options:
Indicator Parameters: Fine-tune lengths and multipliers for Bollinger Bands, Keltner Channels, momentum calculation, and ATR.
Entry Filters: Choose to use trend and RSI filters to refine trade entries based on your strategy.
Risk Management Settings: Adjust stop loss, take profit, and holding periods to match your risk tolerance.
Trade Direction Control: Enable or disable long and short trades independently to align with your market strategy or compliance requirements.
Time Settings: Modify the trading session times and enable or disable the time filter as needed.
Use Cases:
Trend Traders: Benefit from aligning entries with the broader market trend while capturing breakout movements.
Swing Traders: Exploit periods of low volatility leading to significant price swings.
Risk-Averse Traders: Utilize advanced risk management features to protect capital and manage exposure.
Disclaimer:
This strategy is a tool to assist in trading decisions and should be used in conjunction with other analyses and risk management practices. Past performance is not indicative of future results. Always test the strategy thoroughly and adjust settings to suit your specific trading style and market conditions.

SMB MagicSMB Magic
Overview: SMB Magic is a powerful technical strategy designed to capture breakout opportunities based on price movements, volume spikes, and trend-following logic. This strategy works exclusively on the XAU/USD symbol and is optimized for the 15-minute time frame. By incorporating multiple factors, this strategy identifies high-probability trades with a focus on risk management.
Key Features:
Breakout Confirmation:
This strategy looks for price breakouts above the previous high or below the previous low, with a significant volume increase. A breakout is considered valid when it is supported by strong volume, confirming the strength of the price move.
Price Movement Filter:
The strategy ensures that only significant price movements are considered for trades, helping to avoid low-volatility noise. This filter targets larger price swings to maximize potential profits.
Exponential Moving Average (EMA):
A long-term trend filter is applied to ensure that buy trades occur only when the price is above the moving average, and sell trades only when the price is below it.
Fibonacci Levels:
Custom Fibonacci retracement levels are drawn based on recent price action. These levels act as dynamic support and resistance zones and help determine the exit points for trades.
Take Profit/Stop Loss:
The strategy incorporates predefined take profit and stop loss levels, designed to manage risk effectively. These levels are automatically applied to trades and are adjusted based on the market's volatility.
Volume Confirmation:
A volume multiplier confirms the strength of the breakout. A trade is only considered when the volume exceeds a certain threshold, ensuring that the breakout is supported by sufficient market participation.
How It Works:
Entry Signals:
Buy Signal: A breakout above the previous high, accompanied by significant volume and price movement, occurs when the price is above the trend-following filter (e.g., EMA).
Sell Signal: A breakout below the previous low, accompanied by significant volume and price movement, occurs when the price is below the trend-following filter.
Exit Strategy:
Each position (long or short) has predefined take-profit and stop-loss levels, which are designed to protect capital and lock in profits at key points in the market.
Fibonacci Levels:
Fibonacci levels are drawn to identify potential areas of support or resistance, which can be used to guide exits and stop-loss placements.
Important Notes:
Timeframe Restriction: This strategy is designed specifically for the 15-minute time frame.
Symbol Restriction: The strategy works exclusively on the XAU/USD (Gold) symbol and is not recommended for use with other instruments.
Best Performance in Trending Markets: It works best in trending conditions where breakouts occur frequently.
Disclaimer:
Risk Warning: Trading involves risk, and past performance is not indicative of future results. Always conduct your own research and make informed decisions before trading.

Balthazar by Aloupay📈 BALTHAZAR BY ALOUPAY: Advanced Trading Strategy for Precision and Reliability
BALTHAZAR BY ALOUPAY is a comprehensive trading strategy developed for TradingView, designed to assist traders in making informed and strategic trading decisions. By integrating multiple technical indicators, this strategy aims to identify optimal entry and exit points, manage risk effectively, and enhance overall trading performance.
🌟 Key Features
1. Integrated Indicator Suite
Exponential Moving Averages (EMAs) : Utilizes Fast (12), Medium (26), and Slow (50) EMAs to determine trend direction and strength.
Stochastic RSI : Employs Stochastic RSI with customizable smoothing periods to assess momentum and potential reversal points.
Average True Range (ATR) : Calculates dynamic stop loss and take profit levels based on market volatility using ATR multipliers.
MACD Confirmation : Incorporates MACD histogram analysis to validate trade signals, enhancing the reliability of entries.
2. Customizable Backtesting Parameters
Date Range Selection: Allows users to define specific backtesting periods to evaluate strategy performance under various market conditions.
Timezone Adaptability: Ensures accurate time-based filtering in alignment with the chart's timezone settings.
3. Advanced Risk Management
Dynamic Stop Loss & Take Profit: Automatically adjusts exit points using ATR multipliers to adapt to changing market volatility.
Position Sizing: Configurable to risk a sustainable percentage of equity per trade (recommended: 5-10%) to maintain disciplined money management.
4. Clear Trade Signals
Long & Short Entries: Generates actionable signals based on the convergence of EMA alignment, Stochastic RSI crossovers, and MACD confirmation.
Automated Exits: Implements predefined take profit and stop loss levels to secure profits and limit losses without emotional interference.
5. Visual Enhancements
EMA Visualization: Displays Fast, Medium, and Slow EMAs on the chart for easy trend identification.
Stochastic RSI Indicators: Uses distinct shapes to indicate bullish and bearish momentum shifts.
Risk Levels Display: Clearly marks take profit and stop loss levels on the chart for transparent risk-reward assessment.
🔍 Strategy Mechanics
Trend Identification with EMAs
Bullish Trend: Fast EMA (12) > Medium EMA (26) > Slow EMA (50)
Bearish Trend: Fast EMA (12) < Medium EMA (26) < Slow EMA (50)
Momentum Confirmation with Stochastic RSI
Bullish Signal: %K line crosses above %D line, indicating upward momentum.
Bearish Signal: %K line crosses below %D line, signaling downward momentum.
Volatility-Based Risk Management with ATR
Stop Loss: Positioned at 1.0 ATR below (for long) or above (for short) the entry price.
Take Profit: Positioned at 4.0 ATR above (for long) or below (for short) the entry price.
MACD Confirmation
Long Trades: Executed only when the MACD histogram is positive.
Short Trades: Executed only when the MACD histogram is negative.
💱 Recommended Forex Pairs
While BALTHAZAR BY ALOUPAY has shown robust performance on the 4-hour timeframe for Gold (XAU/USD), it is also well-suited for the following highly liquid forex pairs:
EUR/USD (Euro/US Dollar)
GBP/USD (British Pound/US Dollar)
USD/JPY (US Dollar/Japanese Yen)
AUD/USD (Australian Dollar/US Dollar)
USD/CAD (US Dollar/Canadian Dollar)
NZD/USD (New Zealand Dollar/US Dollar)
EUR/GBP (Euro/British Pound)
These pairs offer high liquidity and favorable trading conditions that complement the strategy's indicators and risk management features.
⚙️ Customization Options
Backtesting Parameters
Start Date: Define the beginning of the backtesting period.
End Date: Define the end of the backtesting period.
EMAs Configuration
Fast EMA Length: Default is 12.
Medium EMA Length: Default is 26.
Slow EMA Length: Default is 50.
Source: Default is Close price.
Stochastic RSI Configuration
%K Smoothing: Default is 5.
%D Smoothing: Default is 4.
RSI Length: Default is 14.
Stochastic Length: Default is 14.
RSI Source: Default is Close price.
ATR Configuration
ATR Length: Default is 14.
ATR Smoothing Method: Options include RMA, SMA, EMA, WMA (default: RMA).
Stop Loss Multiplier: Default is 1.0 ATR.
Take Profit Multiplier: Default is 4.0 ATR.
MACD Configuration
MACD Fast Length: Default is 12.
MACD Slow Length: Default is 26.
MACD Signal Length: Default is 9.
📊 Why Choose BALTHAZAR BY ALOUPAY?
Comprehensive Integration: Combines trend, momentum, and volatility indicators for a multifaceted trading approach.
Automated Precision: Eliminates emotional decision-making with rule-based entry and exit signals.
Robust Risk Management: Protects capital through dynamic stop loss and take profit levels tailored to market conditions.
User-Friendly Customization: Easily adjustable settings to align with individual trading styles and risk tolerance.
Proven Reliability: Backtested over extensive periods across various market environments to ensure consistent performance.
Disclaimer : Trading involves significant risk of loss and is not suitable for every investor. Past performance is not indicative of future results. Always conduct your own research and consider your financial situation before engaging in trading activities.

Candle Range Theory [Advanced] - AlgoVisionUnderstanding Candle Range Theory (CRT) in the AlgoVision Indicator
Candle Range Theory (CRT) is a structured approach to analyzing market movements within the price ranges of candlesticks. CRT is founded on the idea that each candlestick on a chart, regardless of timeframe, represents a distinct range of price action, marked by the candle's open, high, low, and close. This range gives insights into market dynamics, and when analyzed in lower timeframes, reveals patterns that indicate underlying market sentiment and institutional behaviors.
Key Concepts of Candle Range Theory
Candlestick Range: The range of a candlestick is simply the distance between its high and low. Across timeframes, this range highlights significant price behavior, with each candlestick representing a snapshot of price movement. The body (distance between open and close) shows the primary price action, while wicks (shadows) reflect price fluctuations or "noise" around this movement.
Multi-Timeframe Analysis: A higher-timeframe (HTF) candlestick can be dissected into smaller, structured price movements in lower timeframes (LTFs). By analyzing these smaller movements, traders gain a detailed view of the market’s progression within the HTF candlestick’s range. Each HTF candlestick’s high and low provide support and resistance levels on the LTF, where the price can "sweep," break out, or retest these levels.
Market Behavior within the Range: Price action within a range doesn’t move randomly; it follows structured behavior, often revealing patterns. By analyzing these patterns, CRT provides insights into the market’s intention to accumulate, manipulate, or distribute assets within these ranges. This behavior can indicate future market direction and increase the probability of accurate trading signals.
CRT and ICT Power of 3: Accumulation, Manipulation, and Distribution (AMD)
A foundational element of our CRT indicator is its combination with ICT’s Power of 3 (Accumulation, Manipulation, and Distribution or AMD). This approach identifies three stages of market movement:
Accumulation: During this phase, institutions accumulate positions within a tight price range, often leading to sideways movement. Here, price consolidates as institutions carefully enter or exit positions, erasing traces of their intent from public view.
Manipulation: Institutions often use manipulation to create false breakouts, targeting retail traders who enter the market on perceived breakouts or reversals. Manipulation is characterized by liquidity grabs, false breakouts, or stop hunts, as price momentarily moves outside the established range before quickly returning.
Distribution: Following accumulation and manipulation, the distribution phase aligns with the true market direction. Institutions now allow the market to move with the trend, initiating a stronger and more sustained price movement that aligns with their intended position.
This AMD cycle is often observed across multiple timeframes, allowing traders to refine entries and exits by identifying accumulation, manipulation, and distribution phases on smaller timeframes within the range of a higher-timeframe candle. CRT views this cycle as the "heartbeat" of the market—a continuous loop of price movements. With our indicator, you can identify this cycle on your current timeframe, with the signal candle acting as the "manipulation" candle.
How to Use the Premium AlgoVision CRT Indicator
1. Indicator Display Options
Bullish/Bearish Plot Indication: Toggles the display of bullish or bearish CRT signals. Turn this on to display signals on your chart or off to reduce screen clutter.
Order Block Indication: Highlights the order block entry price, which is the preferred entry point for CRT trades.
Purge Time Indication: Shows when the low or high of Candle 1 is purged by Candle 2, helping to identify potential manipulation points.
2. Filter Options
Match Indicator Candle with Signal: Ensures that only bullish Candle 2s (for longs) or bearish Candle 2s (for shorts) are signaled. This filter helps eliminate signals where the candlestick’s direction does not align with the CRT model.
Take Profit Already Reached: When enabled, this filter removes CRT signals if take profit levels are reached within Candle 2. This helps focus on setups where there’s still room for price movement.
Midnight Price Filter: Filters signals based on midnight price levels:
Longs: Only signals if the order block entry price is below the midnight price.
Shorts: Only signals if the order block entry price is above the midnight price.
3. Entry and Exit Settings
Wick out prevention: Allows positions to stay open and prevent getting wicked out. Positions will still be able to close if determined by the algorithm.
Buy/Sell: This allows you to set you daily bias. You can select to only see buys or sells.
Custom Stop Loss: Sets a custom stop loss distance from the entry price (e.g., $100 or $200 away) if the predefined stop loss based on Candle 2’s low/high doesn’t suit your preference.
Take Profit Levels: Choose from three take profit levels:
Optimized Take Profit: Uses an optimized take profit level based on CRT’s recommended exit point.
Take Profit 1: Sets an initial take profit level.
Take Profit 2: Sets a secondary take profit level for a more extended exit target.
Timeframe of Order Block: Select the timeframe of the order block entry, which can be tailored based on the timeframe of the CRT signal.
Risk-to-Reward Filter: Filters trades based on a specified risk-to-reward ratio, using the indicator’s stop loss as the base. This helps to ensure trades meet minimum reward criteria.
4. Risk Management
Fixed Entry QTY: This will allow you to open all positions with a fixed QTY
Risk to Reward Ratio: This allows you to set a minimum risk to reward ratio, the strategy will only take trades if this risk to reward is met.
Risk Type:
Fixed Amount: Allows you to risk a fixed $ amount.
% of account: Allows you to risk % of account equity.
5. Day and Time Filters
Filter by Days: Specify the days of the week for CRT signals to appear. For instance, you could enable signals only on Thursdays. This setting can be adjusted to any day or combination of days.
Purge Time Filter: Filters CRT signals based on specific purge times when Candle 1’s low/high is breached by Candle 2, as CRT setups are observed to work best during certain times.
Hour Filters for CRT Signals:
1-Hour CRT Times: Allows filtering CRT signals based on specific 1-hour time intervals.
4-Hour CRT Times: Filter 4-hour CRT signals based on specified times.
Forex and Futures Conversion: Adjusts times based on standard sessions for Forex (e.g., 9:00 AM 4-hour candle) and Futures (e.g., 10 PM candle for Futures or 8 AM for Crypto).
6. Currency and Asset-Specific Filters
Crypto vs. Forex Mode: This setting adjusts the indicator’s timing to match market sessions specific to either crypto or Forex/Futures, ensuring the CRT model aligns with the asset type.
Additional Notes
Backtesting Options: Adjust these to test risk management, such as risking a fixed amount or a percentage of the account, for historical performance insights.
Optimized Settings: This version includes all features and optimized settings, with the most refined data analysis.
Conclusion By combining CRT with ICT Power of 3, the AlgoVision Indicator allows traders to leverage the CRT candlestick as a versatile tool for identifying potential market moves. This method provides beginners and seasoned traders alike with a robust framework to understand market dynamics and refine trade strategies across timeframes. Setting alerts on the higher timeframe to catch bullish or bearish CRT signals allows you to plan and execute trades on the lower timeframe, aligning your strategy with the broader market flow.

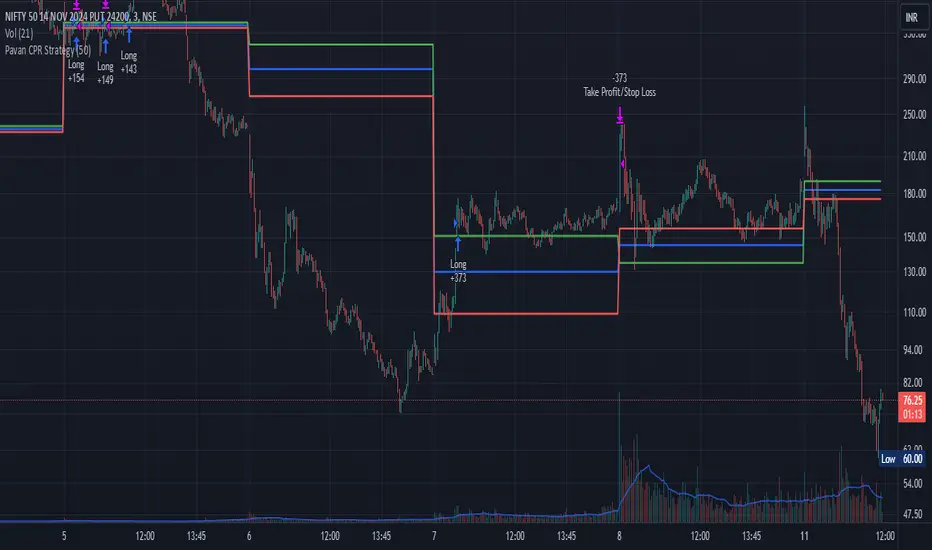
Pavan CPR Strategy Pavan CPR Strategy (Pine Script)
The Pavan CPR Strategy is a trading system based on the Central Pivot Range (CPR), designed to identify price breakouts and generate long trade signals. This strategy uses key CPR levels (Pivot, Top CPR, and Bottom CPR) calculated from the daily high, low, and close to inform trade decisions. Here's an overview of how the strategy works:
Key Components:
CPR Calculation:
The strategy calculates three critical CPR levels for each trading day:
Pivot (P): The central value, calculated as the average of the high, low, and close prices.
Top Central Pivot (TC): The midpoint of the daily high and low, acting as the resistance level.
Bottom Central Pivot (BC): Derived from the pivot and the top CPR, providing a support level.
The script uses request.security to fetch these CPR values from the daily timeframe, even when applied on intraday charts.
Trade Entry Condition:
A long position is initiated when:
The current price crosses above the Top CPR level (TC).
The previous close was below the Top CPR level, signaling a breakout above a key resistance level.
This condition aims to capture upward momentum as the price breaks above a significant level.
Exit Strategy:
Take Profit: The position is closed with a profit target set 50 points above the entry price.
Stop Loss: A stop loss is placed at the Pivot level to protect against unfavorable price movements.
Visual Reference:
The script plots the three CPR levels on the chart:
Pivot: Blue line.
Top CPR (TC): Green line.
Bottom CPR (BC): Red line.
These plotted levels provide visual guidance for identifying potential support and resistance zones.
Use Case:
The Pavan CPR Strategy is ideal for intraday traders who want to capitalize on price movements and breakouts above critical CPR levels. It provides clear entry and exit signals based on price action and is best used in conjunction with proper risk management.
Note: The strategy is written in Pine Script v5 for use on TradingView, and it is recommended to backtest and optimize it for the asset or market you are trading.
Advanced Bitcoin Trend Following StrategyTitle: Bitcoin Multi-Factor Trend Following Strategy
Description:
The Bitcoin Multi-Factor Trend Following Strategy is designed for traders seeking a robust, multi-factor approach to trend following in Bitcoin markets. This script combines technical indicators and statistical methods to identify trend directions, optimize entry and exit points, and manage position sizing based on volatility and leverage constraints. Key features of the strategy include:
Multi-Indicator Trend Forecasting:
This strategy employs three trend forecasting methods: range, exponential moving average (EMA), and Bollinger Bands. Each method can be independently enabled or disabled, giving traders flexibility in how trends are identified and followed.
Range Forecast : Calculates forecast based on the range (high and low) of recent prices, with optional smoothing via a Kalman filter to reduce noise.
EMA Spread Forecast : Utilizes the spread between fast and slow EMAs to gauge the trend’s strength, adjusted for volatility.
Bollinger Band Forecast : Measures the proximity of price to Bollinger Band levels to assess trend intensity.
Kalman Filter for Smoothing:
The Kalman filter is applied to price data for smoother trend estimation, particularly within the range forecast. This allows the strategy to reduce noise and focus on more reliable price signals.
Volatility-Adjusted Position Sizing:
The strategy incorporates volatility targeting to dynamically adjust position sizes based on current market conditions. Traders can set an annualized volatility target to control the risk level, with position size scaled accordingly to maintain consistent risk exposure. A maximum leverage cap ensures that position sizes do not exceed a user-defined threshold, offering an additional layer of risk control.
Dynamic Entry and Exit Points:
Entry and exit points are based on customizable thresholds that determine trend strength and are sensitive to market volatility. The script monitors changes in forecast values and automatically adjusts trades to capitalize on emerging trends or exit weakening ones. The strategy includes an option to close all open positions when trend forecasts fall below defined thresholds, ensuring an automated approach to risk management.
Backtesting and Performance Metrics:
To support strategy optimization, the script includes a backtest mode that calculates key performance metrics such as Sharpe Ratio, Buy & Hold profit, Strategy profit, Win rate, and other metrics. These metrics are displayed in a summary table directly on the chart, providing real-time insight into the strategy’s historical performance compared to a buy-and-hold approach.
Configurable Time and Date Range:
Users can specify start and end dates for the backtest period, allowing for focused backtesting over any desired timeframe. This feature enables in-depth analysis of performance across varying market conditions.
Use Case:
This strategy is best suited for experienced traders who wish to apply a structured trend-following approach in Bitcoin or other high-volatility assets. It is highly customizable, making it adaptable to various market conditions and trading styles. The combination of trend forecasting methods, volatility targeting, and automatic leverage control offers a balanced approach to capturing long-term trends while managing risk.
Parameters:
Entry Threshold: Adjusts the sensitivity of the entry point for trends. Lower values make the strategy more reactive.
Annual Volatility Target: Controls the risk level by targeting a specific annualized volatility percentage.
Max Leverage: Caps the allowable leverage for each trade.
Forecast Activations: Toggles to enable or disable the use of range, EMA, and Bollinger forecasts.
Date Range: Allows users to define the start and end dates for testing the strategy.
Notes:
This strategy is designed for educational purposes and requires thorough backtesting and optimization before live trading. Real-time performance may vary, and additional risk management practices are advised.
License:
This script is subject to the terms of the Mozilla Public License 2.0.

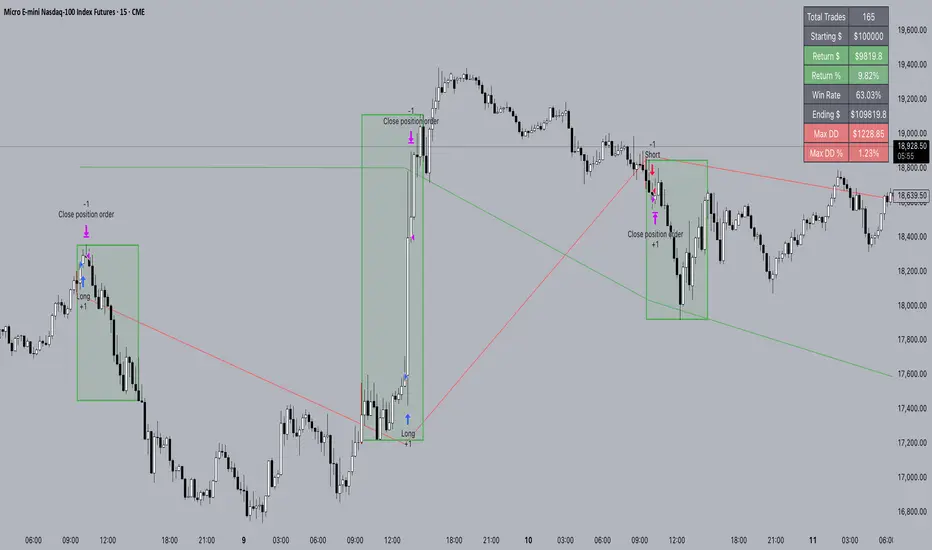
FTMO Rules MonitorFTMO Rules Monitor: Stay on Track with Your FTMO Challenge Goals
TLDR; You can test with this template whether your strategy for one asset would pass the FTMO challenges step 1 then step 2, then with real money conditions.
Passing a prop firm challenge is ... challenging.
I believe a toolkit allowing to test in minutes whether a strategy would have passed a prop firm challenge in the past could be very powerful.
The FTMO Rules Monitor is designed to help you stay within FTMO’s strict risk management guidelines directly on your chart. Whether you’re aiming for the $10,000 or the $200,000 account challenge, this tool provides real-time tracking of your performance against FTMO’s rules to ensure you don’t accidentally breach any limits.
NOTES
The connected indicator for this post doesn't matter.
It's just a dummy double supertrends (see below)
The strategy results for this script post does not matter as I'm posting a FTMO rules template on which you can connect any indicator/strategy.
//@version=5
indicator("Supertrends", overlay=true)
// Supertrend 1 Parameters
var string ST1 = "Supertrend 1 Settings"
st1_atrPeriod = input.int(10, "ATR Period", minval=1, maxval=50, group=ST1)
st1_factor = input.float(2, "Factor", minval=0.5, maxval=10, step=0.5, group=ST1)
// Supertrend 2 Parameters
var string ST2 = "Supertrend 2 Settings"
st2_atrPeriod = input.int(14, "ATR Period", minval=1, maxval=50, group=ST2)
st2_factor = input.float(3, "Factor", minval=0.5, maxval=10, step=0.5, group=ST2)
// Calculate Supertrends
= ta.supertrend(st1_factor, st1_atrPeriod)
= ta.supertrend(st2_factor, st2_atrPeriod)
// Entry conditions
longCondition = direction1 == -1 and direction2 == -1 and direction1 == 1
shortCondition = direction1 == 1 and direction2 == 1 and direction1 == -1
// Optional: Plot Supertrends
plot(supertrend1, "Supertrend 1", color = direction1 == -1 ? color.green : color.red, linewidth=3)
plot(supertrend2, "Supertrend 2", color = direction2 == -1 ? color.lime : color.maroon, linewidth=3)
plotshape(series=longCondition, location=location.belowbar, color=color.green, style=shape.triangleup, title="Long")
plotshape(series=shortCondition, location=location.abovebar, color=color.red, style=shape.triangledown, title="Short")
signal = longCondition ? 1 : shortCondition ? -1 : na
plot(signal, "Signal", display = display.data_window)
To connect your indicator to this FTMO rules monitor template, please update it as follow
Create a signal variable to store 1 for the long/buy signal or -1 for the short/sell signal
Plot it in the display.data_window panel so that it doesn't clutter your chart
signal = longCondition ? 1 : shortCondition ? -1 : na
plot(signal, "Signal", display = display.data_window)
In the FTMO Rules Monitor template, I'm capturing this external signal with this input.source variable
entry_connector = input.source(close, "Entry Connector", group="Entry Connector")
longCondition = entry_connector == 1
shortCondition = entry_connector == -1
🔶 USAGE
This indicator displays essential FTMO Challenge rules and tracks your progress toward meeting each one. Here’s what’s monitored:
Max Daily Loss
• 10k Account: $500
• 25k Account: $1,250
• 50k Account: $2,500
• 100k Account: $5,000
• 200k Account: $10,000
Max Total Loss
• 10k Account: $1,000
• 25k Account: $2,500
• 50k Account: $5,000
• 100k Account: $10,000
• 200k Account: $20,000
Profit Target
• 10k Account: $1,000
• 25k Account: $2,500
• 50k Account: $5,000
• 100k Account: $10,000
• 200k Account: $20,000
Minimum Trading Days: 4 consecutive days for all account sizes
🔹 Key Features
1. Real-Time Compliance Check
The FTMO Rules Monitor keeps track of your daily and total losses, profit targets, and trading days. Each metric updates in real-time, giving you peace of mind that you’re within FTMO’s rules.
2. Color-Coded Visual Feedback
Each rule’s status is shown clearly with a ✓ for compliance or ✗ if the limit is breached. When a rule is broken, the indicator highlights it in red, so there’s no confusion.
3. Completion Notification
Once all FTMO requirements are met, the indicator closes all open positions and displays a celebratory message on your chart, letting you know you’ve successfully completed the challenge.
4. Easy-to-Read Table
A table on your chart provides an overview of each rule, your target, current performance, and whether you’re meeting each goal. The table adjusts its color scheme based on your chart settings for optimal visibility.
5. Dynamic Position Sizing
Integrated ATR-based position sizing helps you manage risk and avoid large drawdowns, ensuring each trade aligns with FTMO’s risk management principles.
Daveatt

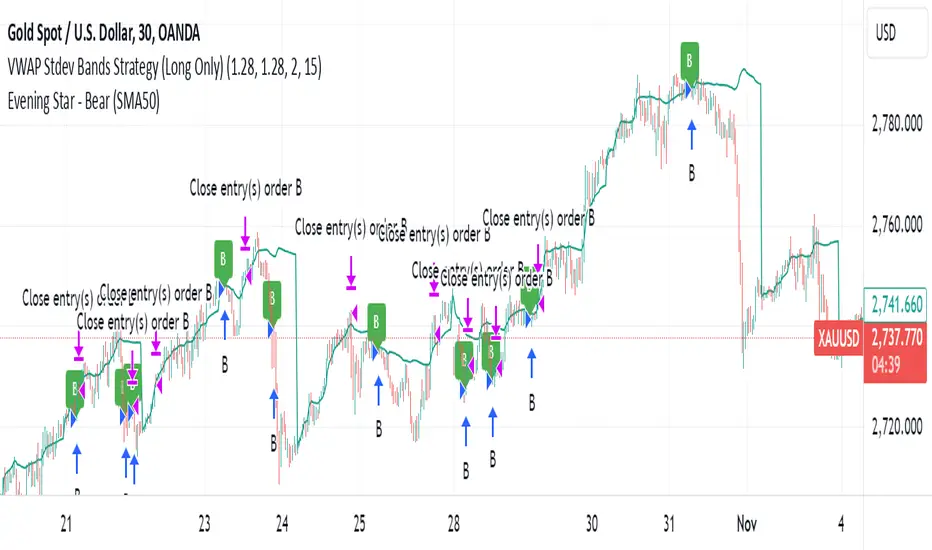
VWAP Stdev Bands Strategy (Long Only)The VWAP Stdev Bands Strategy (Long Only) is designed to identify potential long entry points in trending markets by utilizing the Volume Weighted Average Price (VWAP) and standard deviation bands. This strategy focuses on capturing upward price movements, leveraging statistical measures to determine optimal buy conditions.
Key Features:
VWAP Calculation: The strategy calculates the VWAP, which represents the average price a security has traded at throughout the day, weighted by volume. This is an essential indicator for determining the overall market trend.
Standard Deviation Bands: Two bands are created above and below the VWAP, calculated using specified standard deviations. These bands act as dynamic support and resistance levels, providing insight into price volatility and potential reversal points.
Trading Logic:
Long Entry Condition: A long position is triggered when the price crosses below the lower standard deviation band and then closes above it, signaling a potential price reversal to the upside.
Profit Target: The strategy allows users to set a predefined profit target, closing the long position once the specified target is reached.
Time Gap Between Orders: A customizable time gap can be specified to prevent multiple orders from being placed in quick succession, allowing for a more controlled trading approach.
Visualization: The VWAP and standard deviation bands are plotted on the chart with distinct colors, enabling traders to visually assess market conditions. The strategy also provides optional plotting of the previous day's VWAP for added context.
Use Cases:
Ideal for traders looking to engage in long-only positions within trending markets.
Suitable for intraday trading strategies or longer-term approaches based on market volatility.
Customization Options:
Users can adjust the standard deviation values, profit target, and time gap to tailor the strategy to their specific trading style and market conditions.
Note: As with any trading strategy, it is important to conduct thorough backtesting and analysis before live trading. Market conditions can change, and past performance does not guarantee future results.
PTS - Bollinger Bands with Trailing StopPTS - Bollinger Bands with Trailing Stop Strategy
Overview
The "PTS - Bollinger Bands with Trailing Stop" strategy is designed to capitalize on strong bullish market movements by combining the Bollinger Bands indicator with a dynamic trailing stop based on the Average True Range (ATR). This strategy aims to enter long positions during upward breakouts and protect profits through an adaptive exit mechanism.
Key Features
1. Bollinger Bands Indicator
Basis Moving Average Type: Choose from SMA, EMA, SMMA, WMA, or VWMA for the Bollinger Bands' basis line. Length: Adjustable period for calculating the moving average and standard deviation (default is 20). Standard Deviation Multiplier (StdDev): Determines the width of the bands (default is 2.0). Source: Select the price data used for calculations (default is the closing price).
2. Entry Conditions
The strategy enters a long position when the closing price crosses above the upper Bollinger Band , indicating strong upward momentum.
3. Exit Conditions
Trailing Stop Loss: Implemented using ATR to adjust dynamically with market volatility. ATR Length: Period for calculating ATR (default is 14). ATR Multiplier for Trailing Stop: Determines how closely the trailing stop follows the price (default is 2.0). Close Below Lower Bollinger Band: The strategy exits the long position if the closing price crosses below the lower Bollinger Band .
4. Risk Management
Commission and Slippage: Commission is set at 0.1%; slippage is set to 3. Position Sizing: Uses 100% of equity per trade (adjustable).
5. Date Range Filter
Specify the time period during which the strategy is active. Start Date: January 1, 2018. End Date: December 31, 2069.
Customizable Inputs
BB Length: Adjust the period for Bollinger Bands calculation. BB StdDev: Modify the standard deviation multiplier. Basis MA Type: Select the moving average type. Source: Choose the price data source. Offset: Shift the Bollinger Bands on the chart. ATR Length: Set the period for ATR calculation. ATR Multiplier for Trailing Stop: Adjust the trailing stop sensitivity.
Thought for 1m 7s
Description for the "PTS - Bollinger Bands with Trailing Stop" Strategy
PTS - Bollinger Bands with Trailing Stop Strategy
Overview
The "PTS - Bollinger Bands with Trailing Stop" strategy is designed to capitalize on strong bullish market movements by combining the Bollinger Bands indicator with a dynamic trailing stop based on the Average True Range (ATR). This strategy aims to enter long positions during upward breakouts and protect profits through an adaptive exit mechanism.
Key Features
1. Bollinger Bands Indicator
Basis Moving Average Type: Choose from SMA, EMA, SMMA, WMA, or VWMA for the Bollinger Bands' basis line. Length: Adjustable period for calculating the moving average and standard deviation (default is 20). Standard Deviation Multiplier (StdDev): Determines the width of the bands (default is 2.0). Source: Select the price data used for calculations (default is the closing price).
2. Entry Conditions
The strategy enters a long position when the closing price crosses above the upper Bollinger Band , indicating strong upward momentum.
3. Exit Conditions
Trailing Stop Loss: Implemented using ATR to adjust dynamically with market volatility. ATR Length: Period for calculating ATR (default is 14). ATR Multiplier for Trailing Stop: Determines how closely the trailing stop follows the price (default is 2.0). Close Below Lower Bollinger Band: The strategy exits the long position if the closing price crosses below the lower Bollinger Band .
4. Risk Management
Commission and Slippage: Commission is set at 0.1%; slippage is set to 3. Position Sizing: Uses 100% of equity per trade (adjustable).
5. Date Range Filter
Specify the time period during which the strategy is active. Start Date: January 1, 2018. End Date: December 31, 2069.
Customizable Inputs
BB Length: Adjust the period for Bollinger Bands calculation. BB StdDev: Modify the standard deviation multiplier. Basis MA Type: Select the moving average type. Source: Choose the price data source. Offset: Shift the Bollinger Bands on the chart. ATR Length: Set the period for ATR calculation. ATR Multiplier for Trailing Stop: Adjust the trailing stop sensitivity.
How the Strategy Works
1. Initialization
Calculates Bollinger Bands and ATR based on selected parameters.
2. Entry Logic
Opens a long position when the closing price exceeds the upper Bollinger Band.
3. Exit Logic
Uses a trailing stop loss based on ATR. Exits if the closing price drops below the lower Bollinger Band.
4. Date Filtering
Executes trades only within the specified date range.
Advantages
Adaptive Risk Management: Trailing stop adjusts to market volatility. Simplicity: Clear entry and exit signals. Customizable Parameters: Tailor the strategy to different assets or conditions.
Considerations
Aggressive Position Sizing: Using 100% equity per trade is high-risk. Market Conditions: Best in trending markets; may produce false signals in sideways markets. Backtesting: Always test on historical data before live trading.
Disclaimer
This strategy is intended for educational and informational purposes only. Trading involves significant risk, and past performance is not indicative of future results. Assess your financial situation and consult a financial advisor if necessary.
Usage Instructions
1. Apply the Strategy: Add it to your TradingView chart. 2. Configure Inputs: Adjust parameters to suit your style and asset. 3. Analyze Backtest Results: Use the Strategy Tester. 4. Optimize Parameters: Experiment with input values. 5. Risk Management: Evaluate position sizing and incorporate risk controls.
Final Notes
The "PTS - Bollinger Bands with Trailing Stop" strategy provides a framework to leverage momentum breakouts while managing risk through adaptive trailing stops. Customize and test thoroughly to align with your trading objectives.

Dual Momentum StrategyThis Pine Script™ strategy implements the "Dual Momentum" approach developed by Gary Antonacci, as presented in his book Dual Momentum Investing: An Innovative Strategy for Higher Returns with Lower Risk (McGraw Hill Professional, 2014). Dual momentum investing combines relative momentum and absolute momentum to maximize returns while minimizing risk. Relative momentum involves selecting the asset with the highest recent performance between two options (a risky asset and a safe asset), while absolute momentum considers whether the chosen asset has a positive return over a specified lookback period.
In this strategy:
Risky Asset (SPY): Represents a stock index fund, typically more volatile but with higher potential returns.
Safe Asset (TLT): Represents a bond index fund, which generally has lower volatility and acts as a hedge during market downturns.
Monthly Momentum Calculation: The momentum for each asset is calculated based on its price change over the last 12 months. Only assets with a positive momentum (absolute momentum) are considered for investment.
Decision Rules:
Invest in the risky asset if its momentum is positive and greater than that of the safe asset.
If the risky asset’s momentum is negative or lower than the safe asset's, the strategy shifts the allocation to the safe asset.
Scientific Reference
Antonacci's work on dual momentum investing has shown the strategy's ability to outperform traditional buy-and-hold methods while reducing downside risk. This approach has been reviewed and discussed in both academic and investment publications, highlighting its strong risk-adjusted returns (Antonacci, 2014).
Reference: Antonacci, G. (2014). Dual Momentum Investing: An Innovative Strategy for Higher Returns with Lower Risk. McGraw Hill Professional.

DSL Strategy [DailyPanda]
Overview
The DSL Strategy by DailyPanda is a trading strategy that synergistically combines the idea from indicators to create a more robust and reliable trading tool. By integrating these indicators, the strategy enhances signal accuracy and provides traders with a comprehensive view of market trends and momentum shifts. This combination allows for better entry and exit points, improved risk management, and adaptability to various market conditions.
Combining ideas from indicators adds value by:
Enhancing Signal Confirmation : The strategy requires alignment between trend and momentum before generating trade signals, reducing false entries.
Improving Accuracy : By integrating price action with momentum analysis, the strategy captures more reliable trading opportunities.
Providing Comprehensive Market Insight : The combination offers a better perspective on the market, considering both the direction (trend) and the strength (momentum) of price movements.
How the Components Work Together
1. Trend Identification with DSL Indicator
Dynamic Signal Lines : Calculates upper and lower DSL lines based on a moving average (SMA) and dynamic thresholds derived from recent highs and lows with a specified offset. These lines adapt to market conditions, providing real-time trend insights.
ATR-Based Bands : Adds bands around the DSL lines using the Average True Range (ATR) multiplied by a width factor. These bands account for market volatility and help identify potential stop-loss levels.
Trend Confirmation : The relationship between the price, DSL lines, and bands determines the current trend. For example, if the price consistently stays above the upper DSL line, it indicates a bullish trend.
2. Momentum Analysis
RSI Calculation : Computes the RSI over a specified period to measure the speed and change of price movements.
Zero-Lag EMA (ZLEMA) : Applies a ZLEMA to the RSI to minimize lag and produce a more responsive oscillator.
DSL Application on Oscillator : Implements the DSL concept on the oscillator by calculating dynamic upper and lower levels. This helps identify overbought or oversold conditions more accurately.
Signal Generation : Detects crossovers between the oscillator and its DSL lines. A crossover above the lower DSL line signals potential bullish momentum, while a crossover below the upper DSL line signals potential bearish momentum.
3. Integrated Signal Filtering
Confluence Requirement : A trade signal is generated only when both the DSL indicator and oscillator agree. For instance, a long entry requires both an uptrend confirmation from the DSL indicator and a bullish momentum signal from the oscillator.
Risk Management Integration : The strategy uses the DSL indicator's bands for setting stop-loss levels and calculates take-profit levels based on a user-defined risk-reward ratio. This ensures that every trade has a predefined risk management plan.
--------------------------------------------------------------------------------------------
Originality and Value Added to the Community
Unique Synergy : While both indicators are available individually, this strategy is original in how it combines them to enhance their strengths and mitigate their weaknesses, offering a novel approach not present in existing scripts.
Enhanced Reliability : By requiring confirmation from both trend and momentum indicators, the strategy reduces false signals and increases the likelihood of successful trades.
Versatility : The customizable parameters allow traders to adapt the strategy to different instruments, timeframes, and trading styles, making it a valuable tool for a wide range of trading scenarios.
Educational Contribution : The script demonstrates an effective method of combining indicators for improved trading performance, providing insights that other traders can learn from and apply to their own strategies.
--------------------------------------------------------------------------------------------
How to Use the Strategy
Adding the Strategy to Your Chart
Apply the DSL Strategy to your desired trading instrument and timeframe on TradingView.
--------------------------------------------------------------------------------------------
Configuring Parameters
DSL Indicator Settings :
Length (len) : Adjusts the sensitivity of the DSL lines (default is 34).
Offset : Determines the look-back period for threshold calculations (default is 30).
Bands Width (width) : Changes the distance of the ATR-based bands from the DSL lines (default is 1).
DSL-BELUGA Oscillator Settings :
Beluga Length (len_beluga) : Sets the period for the RSI calculation in the oscillator (default is 10).
DSL Lines Mode (dsl_mode) : Chooses between "Fast" (more responsive) and "Slow" (smoother) modes for the oscillator's DSL lines.
Risk Management :
Risk Reward (risk_reward) : Defines your desired risk-reward ratio for calculating take-profit levels (default is 1.5).
--------------------------------------------------------------------------------------------
Interpreting Signals
Long Entry Conditions :
Trend Confirmation : Price is above the upper DSL line and the upper DSL band (dsl_up1 > dsl_dn).
Price Behavior : The last three candles have both their opens and closes above the upper DSL line.
Momentum Signal : The DSL-BELUGA oscillator crosses above its lower DSL line (up_signal), indicating bullish momentum.
Short Entry Conditions :
Trend Confirmation : Price is below the lower DSL line and the lower DSL band (dsl_dn < dsl_up1).
Price Behavior : The last three candles have both their opens and closes below the lower DSL band.
Momentum Signal : The DSL-BELUGA oscillator crosses below its upper DSL line (dn_signal), indicating bearish momentum.
Exit Conditions :
Stop-Loss : Automatically set at the DSL indicator's band level (upper band for longs, lower band for shorts).
Take-Profit : Calculated based on the risk-reward ratio and the initial risk determined by the stop-loss distance.
Visual Aids
Signal Arrows : Upward green arrows for long entries and downward blue arrows for short entries appear on the chart when conditions are met.
Stop-Loss and Take-Profit Lines : Red and green lines display the calculated stop-loss and take-profit levels for active trades.
Background Highlighting : The chart background subtly changes color to indicate when a signal has been generated.
Backtesting and Optimization
Use TradingView's strategy tester to backtest the strategy over historical data.
Adjust parameters to optimize performance for different instruments or market conditions.
Regularly review backtesting results to ensure the strategy remains effective.

Universal Trend Following Strategy | QuantumRsearchUniversal All Assets Strategy by Rocheur
The Universal All Assets Strategy is a cutting-edge, trend-following algorithm designed to operate seamlessly across multiple asset classes, including equities, commodities, forex, and cryptocurrencies. This strategy leverages the power of eight unique indicators, offering traders robust, adaptive signals. Its dynamic logic, combined with a comprehensive risk management framework, allows for precision trading in a variety of market conditions.
Core Methodologies and Features
1. Eight Integrated Trend Indicators
At the heart of the Universal All Assets Strategy are eight sophisticated trend-following indicators, each designed to capture different facets of market behavior. These indicators work together to provide a multi-dimensional analysis of price trends, filtering out noise and reacting only to significant movements:
Directional Moving Averages : Tracks the primary market trend, offering a clear indication of long-term price direction, ideal for identifying sustained upward or downward movements.
Smoothed Moving Averages : Reduces short-term volatility and noise to reveal the underlying trend, enhancing signal clarity and helping traders avoid reacting to temporary price spikes.
RSI Loops : Utilizes the Relative Strength Index (RSI) to assess market momentum, using a unique for loop mechanism to smooth out data and enhance precision.
Supertrend Filters : This indicator dynamically adjusts to market volatility, closely following price action to detect significant breakouts or reversals. The Supertrend is a core component for identifying shifts in trend direction with minimal lag.
RVI for Loop : The Relative Volatility Index (RVI) measures the strength of market volatility. It is optimized with a for loop mechanism, which smooths out the data and improves directional cues, especially in choppy or sideways markets.
Hull for Loop : The Hull Moving Average is designed to minimize lag while offering a smooth, responsive trend line. The for loop mechanism further enhances this by making the Hull even more sensitive to trend shifts, ensuring faster reaction to market movements without generating excessive noise.
These indicators evaluate market conditions independently, assigning a score of 1 for bullish trends and -1 for bearish trends. The average score across all eight indicators is calculated for each time frame (or bar), and this score determines whether the strategy should enter, exit, or remain neutral in a trade.
2. Scoring and Signal Confirmation
The strategy’s confirmation system ensures that trades are initiated only when there is strong alignment across multiple indicators:
A Long Position (Buy) is initiated when the majority of indicators generate a bullish signal, i.e., the average score exceeds a predefined upper threshold.
A Short Position or Exit is triggered when the average score falls below a lower threshold, signaling a bearish trend or neutral market.
By using a majority-rule confirmation system, the strategy filters out weak signals, reducing the chances of reacting to market noise or false positives. This ensures that only robust trends—those supported by multiple indicators—trigger trades.
Adaptive Logic for All Asset Classes
The Universal All Assets Strategy stands out for its ability to adapt dynamically across different asset classes. Whether it’s applied to highly volatile assets like cryptocurrencies or more stable instruments like equities, the strategy fine-tunes its behavior to match the asset’s volatility profile and price behavior.
Volatility Filters : The system incorporates volatility-sensitive filters, such as the Average True Range (ATR) and standard deviation metrics, which dynamically adjust its sensitivity based on market conditions. This ensures the strategy remains responsive to significant price movements while filtering out inconsequential fluctuations.
This adaptability makes the Universal All Assets Strategy effective across diverse markets, providing consistent performance whether the market is trending, range-bound, or experiencing high volatility.
Customization and Flexibility
1. Directional Bias
The strategy offers traders the flexibility to set a customizable directional bias, allowing it to focus on:
Long-only trades during bullish markets.
Short-only trades during bear markets.
Bi-directional trades for those looking to capitalize on both uptrends and downtrends.
This bias can be fine-tuned based on market conditions, trader preference, or risk tolerance, without compromising the integrity of the overall signal-generation process.
2. Volatility Sensitivity
Traders can adjust the strategy’s volatility sensitivity through customizable settings. By modifying how the system reacts to volatility, traders can make the strategy more aggressive in high-volatility environments or more conservative in quieter markets, depending on their individual trading style.
Visual Representation of Component Behavior
One of the unique features of the strategy is its real-time visual representation of the eight indicators through a component table displayed on the chart. This table provides a clear overview of the current status of each indicator:
A score of 1 indicates a bullish signal.
A score of -1 indicates a bearish signal.
The table is updated at each time frame (bar), showing how each indicator is contributing to the overall trend decision. This real-time feedback allows traders to monitor the exact composition of the strategy’s signal, helping them better understand market dynamics.
Oscillator Visualization for Trend Detection
To complement the component table, the strategy includes a trend oscillator displayed beneath the price chart, offering a visual summary of the overall market direction:
Green bars represent bullish trends when the majority of indicators signal an uptrend.
Red bars represent bearish trends or a neutral (cash) position when the majority of indicators detect a downtrend.
This oscillator allows traders to quickly assess the market’s overall direction at a glance, without needing to analyze each individual indicator, providing a clear and immediate visual of the market trend.
Backtested and Forward-Tested for Real-World Conditions
The Universal All Assets Strategy has been thoroughly tested under real-world trading conditions, incorporating key factors like:
Slippage : Set at 20 ticks to represent real market fluctuations.
Order Size : Calculated as 10% of equity, ensuring appropriate risk exposure for realistic capital management.
Commission : A fee of 0.05% has been factored in to account for trading costs.
These settings ensure that the strategy’s performance metrics—such as the Sortino Ratio , Sharpe Ratio , Omega Ratio , and Profit Factor —are reflective of actual trading environments. The rigorous backtesting and forward-testing processes ensure that the strategy produces realistic results, making it compatible with the markets it is written for and demonstrating how the system would behave in live conditions. It also includes robust risk management tools to minimize drawdowns and preserve capital, making it suitable for both professional and retail traders.
Anti-Fragile Design and Realistic Expectations
The Universal All Assets Strategy is engineered to be anti-fragile, thriving in volatile markets by adjusting to turbulence rather than being damaged by it. This is a crucial feature that ensures the strategy remains effective even during times of significant market instability.
Moreover, the strategy is transparent about realistic expectations, acknowledging that no system can guarantee a 100% win rate and that past performance is not indicative of future results. This transparency fosters trust and provides traders with a realistic framework for long-term success, making it an ideal choice for traders looking to navigate complex market conditions with confidence.
Acknowledgment of External Code
Special credit goes to bii_vg, whose invite-only code was used with permission in the development of the Universal All Assets Strategy. Their contributions have been instrumental in refining certain aspects of this strategy, ensuring its robustness and adaptability across various markets.
Conclusion
The Universal All Assets Strategy by Rocheur offers traders a powerful, adaptable tool for capturing trends across a wide range of asset classes. Its eight-indicator confirmation system, combined with customizable settings and real-time visual representations, provides a comprehensive solution for traders seeking precision, flexibility, and consistency. Whether used in high-volatility markets or more stable environments, the strategy’s dynamic adaptability, transparent logic, and robust testing make it an excellent choice for traders aiming to maximize performance while managing risk effectively.

Advanced Multi-Seasonality StrategyThe Multi-Seasonality Strategy is a trading system based on seasonal market patterns. Seasonality refers to recurring market trends driven by predictable calendar-based events. These patterns emerge due to economic cycles, corporate activities (e.g., earnings reports), and investor behavior around specific times of the year. Studies have shown that such effects can influence asset prices over defined periods, leading to opportunities for traders who exploit these patterns (Hirshleifer, 2001; Bouman & Jacobsen, 2002).
How the Strategy Works:
The strategy allows the user to define four distinct periods within a calendar year. For each period, the trader selects:
Entry Date (Month and Day): The date to enter the trade.
Holding Period: The number of trading days to remain in the trade after the entry.
Trade Direction: Whether to take a long or short position during that period.
The system is designed with flexibility, enabling the user to activate or deactivate each of the four periods. The idea is to take advantage of seasonal patterns, such as buying during historically strong periods and selling during weaker ones. A well-known example is the "Sell in May and Go Away" phenomenon, which suggests that stock returns are higher from November to April and weaker from May to October (Bouman & Jacobsen, 2002).
Seasonality in Financial Markets:
Seasonal effects have been documented across different asset classes and markets:
Equities: Stock markets tend to exhibit higher returns during certain months, such as the "January effect," where prices rise after year-end tax-loss selling (Haugen & Lakonishok, 1987).
Commodities: Agricultural commodities often follow seasonal planting and harvesting cycles, which impact supply and demand patterns (Fama & French, 1987).
Forex: Currency pairs may show strength or weakness during specific quarters based on macroeconomic factors, such as fiscal year-end flows or central bank policy decisions.
Scientific Basis:
Research shows that market anomalies like seasonality are linked to behavioral biases and institutional practices. For example, investors may respond to tax incentives at the end of the year, and companies may engage in window dressing (Haugen & Lakonishok, 1987). Additionally, macroeconomic factors, such as monetary policy shifts and holiday trading volumes, can also contribute to predictable seasonal trends (Bouman & Jacobsen, 2002).
Risks of Seasonal Trading:
While the strategy seeks to exploit predictable patterns, there are inherent risks:
Market Changes: Seasonal effects observed in the past may weaken or disappear as market conditions evolve. Increased algorithmic trading, globalization, and policy changes can reduce the reliability of historical patterns (Lo, 2004).
Overfitting: One of the risks in seasonal trading is overfitting the strategy to historical data. A pattern that worked in the past may not necessarily work in the future, especially if it was based on random chance or external factors that no longer apply (Sullivan, Timmermann, & White, 1999).
Liquidity and Volatility: Trading during specific periods may expose the trader to low liquidity, especially around holidays or earnings seasons, leading to slippage and larger-than-expected price swings.
Economic and Geopolitical Shocks: External events such as pandemics, wars, or political instability can disrupt seasonal patterns, leading to unexpected market behavior.
Conclusion:
The Multi-Seasonality Strategy capitalizes on the predictable nature of certain calendar-based patterns in financial markets. By entering and exiting trades based on well-established seasonal effects, traders can potentially capture short-term profits. However, caution is necessary, as market dynamics can change, and seasonal patterns are not guaranteed to persist. Rigorous backtesting, combined with risk management practices, is essential to successfully implementing this strategy.
References:
Bouman, S., & Jacobsen, B. (2002). The Halloween Indicator, "Sell in May and Go Away": Another Puzzle. American Economic Review, 92(5), 1618-1635.
Fama, E. F., & French, K. R. (1987). Commodity Futures Prices: Some Evidence on Forecast Power, Premiums, and the Theory of Storage. Journal of Business, 60(1), 55-73.
Haugen, R. A., & Lakonishok, J. (1987). The Incredible January Effect: The Stock Market's Unsolved Mystery. Dow Jones-Irwin.
Hirshleifer, D. (2001). Investor Psychology and Asset Pricing. Journal of Finance, 56(4), 1533-1597.
Lo, A. W. (2004). The Adaptive Markets Hypothesis: Market Efficiency from an Evolutionary Perspective. Journal of Portfolio Management, 30(5), 15-29.
Sullivan, R., Timmermann, A., & White, H. (1999). Data-Snooping, Technical Trading Rule Performance, and the Bootstrap. Journal of Finance, 54(5), 1647-1691.
This strategy harnesses the power of seasonality but requires careful consideration of the risks and potential changes in market behavior over time.

Statistical ArbitrageThe Statistical Arbitrage Strategy, also known as pairs trading, is a quantitative trading method that capitalizes on price discrepancies between two correlated assets. The strategy assumes that over time, the prices of these two assets will revert to their historical relationship. The core idea is to take advantage of mean reversion, a principle suggesting that asset prices will revert to their long-term average after deviating significantly.
Strategy Mechanics:
1. Selection of Correlated Assets:
• The strategy focuses on two historically correlated assets (e.g., equity index futures like Dow Jones Mini and S&P 500 Mini). These assets tend to move in the same direction due to similar underlying fundamentals, such as overall market conditions. By tracking their relative prices, the strategy seeks to exploit temporary mispricings.
2. Spread Calculation:
• The spread is the difference between the prices of the two assets. This spread represents the relationship between the assets and serves as the basis for determining when to enter or exit trades.
3. Mean and Standard Deviation:
• The historical average (mean) of the spread is calculated using a Simple Moving Average (SMA) over a chosen period. The strategy also computes the standard deviation (volatility) of the spread, which measures how far the spread has deviated from the mean over time. This allows the strategy to define statistically significant price deviations.
4. Entry Signal (Mean Reversion):
• A buy signal is triggered when the spread falls below the mean by a multiple (e.g., two) of the standard deviation. This indicates that one asset is temporarily undervalued relative to the other, and the strategy expects the spread to revert to its mean, generating profits as the prices converge.
5. Exit Signal:
• The strategy exits the trade when the spread reverts to the mean. At this point, the mispricing has been corrected, and the profit from the mean reversion is realized.
Academic Support:
Statistical arbitrage has been widely studied in finance and economics. Gatev, Goetzmann, and Rouwenhorst’s (2006) landmark study on pairs trading demonstrated that this strategy could generate excess returns in equity markets. Their research found that by focusing on historically correlated stocks, traders could identify pricing anomalies and profit from their eventual correction.
Additionally, Avellaneda and Lee (2010) explored statistical arbitrage in different asset classes and found that exploiting deviations in price relationships can offer a robust, market-neutral trading strategy. In these studies, the strategy’s success hinges on the stability of the relationship between the assets and the timely execution of trades when deviations occur.
Risks of Statistical Arbitrage:
1. Correlation Breakdown:
• One of the primary risks is the breakdown of correlation between the two assets. Statistical arbitrage assumes that the historical relationship between the assets will hold in the future. However, market conditions, company fundamentals, or external shocks (e.g., macroeconomic changes) can cause these assets to deviate permanently, leading to potential losses.
• For instance, if two equity indices historically move together but experience divergent economic conditions or policy changes, their prices may no longer revert to the expected mean.
2. Execution Risk:
• This strategy relies on efficient execution and tight spreads. In volatile or illiquid markets, the actual price at which trades are executed may differ significantly from expected prices, leading to slippage and reduced profits.
3. Market Risk:
• Although statistical arbitrage is designed to be market-neutral (i.e., not dependent on the overall market direction), it is not entirely risk-free. Systematic market shocks, such as financial crises or sudden shifts in market sentiment, can affect both assets simultaneously, causing the spread to widen rather than revert to the mean.
4. Model Risk:
• The assumptions underlying the strategy, particularly regarding mean reversion, may not always hold true. The model assumes that asset prices will return to their historical averages within a certain timeframe, but the timing and magnitude of mean reversion can be uncertain. Misestimating this timeframe can lead to extended drawdowns or unrealized losses.
5. Overfitting:
• Over-reliance on historical data to fine-tune the strategy parameters (e.g., the lookback period or standard deviation thresholds) may result in overfitting. This means that the strategy works well on past data but fails to perform in live markets due to changing conditions.
Conclusion:
The Statistical Arbitrage Strategy offers a systematic and quantitative approach to trading that capitalizes on temporary price inefficiencies between correlated assets. It has been proven to generate returns in academic studies and is widely used by hedge funds and institutional traders for its market-neutral characteristics. However, traders must be aware of the inherent risks, including correlation breakdown, execution risks, and the potential for prolonged deviations from the mean. Effective risk management, diversification, and constant monitoring are essential for successfully implementing this strategy in live markets.

Stochastic RSI OHLC StrategyThe script titled "Stochastic RSI High Low Close Bars" is a versatile trading strategy implemented in Pine Script, designed for TradingView. Here's an overview of its features:
Description
This strategy leverages the Stochastic RSI to determine entry and exit signals in the market, focusing on high, low, and close values of the indicator. It incorporates various trading styles, stop-loss mechanisms, and multi-timeframe analysis to adapt to different market conditions.
Key Features
Stochastic RSI Analysis:
Uses the Stochastic RSI to identify potential entry points for long and short positions.
Tracks high, low, and close values for more granular analysis.
Multiple Trading Styles:
Supports diverse trading styles like Volume Color Swing, RSI Divergence, RSI Pullback, and more.
Allows switching between these styles to suit market dynamics.
Session-Based Trading:
Offers session control, limiting trades to specific hours (e.g., NY sessions).
Can close all positions at the end of the trading day.
Stop-Loss and Take-Profit Mechanisms:
Includes both static and dynamic stop-losses, with options for time-based stops, trailing stops, and momentum-based exits.
Customizable take-profit levels ensure efficient trade management.
Volume Analysis:
Integrates volume indicators to add a bias for trade entries and exits, enhancing signal reliability.
Multi-Timeframe Integration:
Employs multi-timeframe RSI analysis, allowing the strategy to capture broader trends and optimize entries.
This script is designed to provide flexibility and adaptability, making it useful for different trading strategies and market conditions. It is suitable for traders looking to refine their entries and exits with a focus on the Stochastic RSI.
